Cutting-edge techniques and procedures are used to characterize the response of a wide range of crops to more than 160 technologies studied over the past 10 years. Whether seed, soil or foliar applications, the measurement techniques or procedures are continually updated by our international research and development experts. AgriThority, in collaboration with experienced independent registered Contract Researchers and University Scientists, conducted more than 1400 studies in their high-quality technology laboratories, greenhouse, and research facilities. To fully explore or validate the potential and position innovations with scientific data and analysis for 185+ multinational and small size clients, AgriThority also has tested methods of assessment since 2010.
Plant root growth assessments through Rhizotrons:
Rhizotrons, a tool for making non-destructive, repeated observation and measurements of root systems, have been used successfully in early product development efficacy trials to calibrate rate and to study compatibility and early crop response to work out the synergies for their use in field studies on row and speciality crops. Descriptive and semi-quantitative data on simultaneous changes in root and shoot system architect of plants in response to different soil amendments and plant nutrient enhancers have been recorded over a period of four to seven weeks. Rhizotrons specially designed to allow measurements of mass balances of water and nutrients within the rooting volume of a crop were successfully used to study the effect of various products on plant emergence, changes in root and shoot development under controlled conditions such as water stress and measured nutrient application.
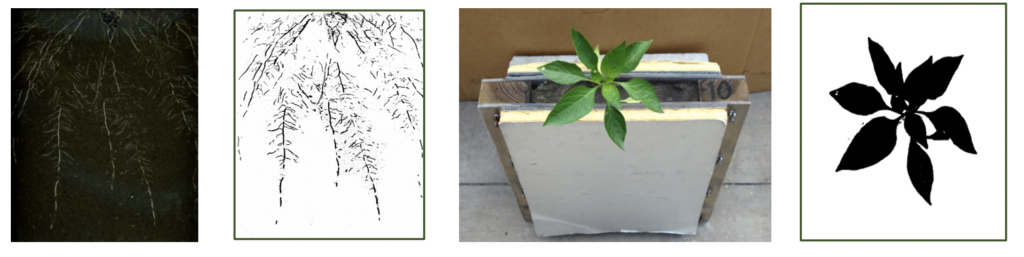
Scanner based rhizotron system were used to characterize root morphological response of bell pepper, strawberry and tomato transplants to plant nutrient enhancers and fertilizers. Rhizotron enabled the scanning of entire root system throughout the growing season (Figure 1).
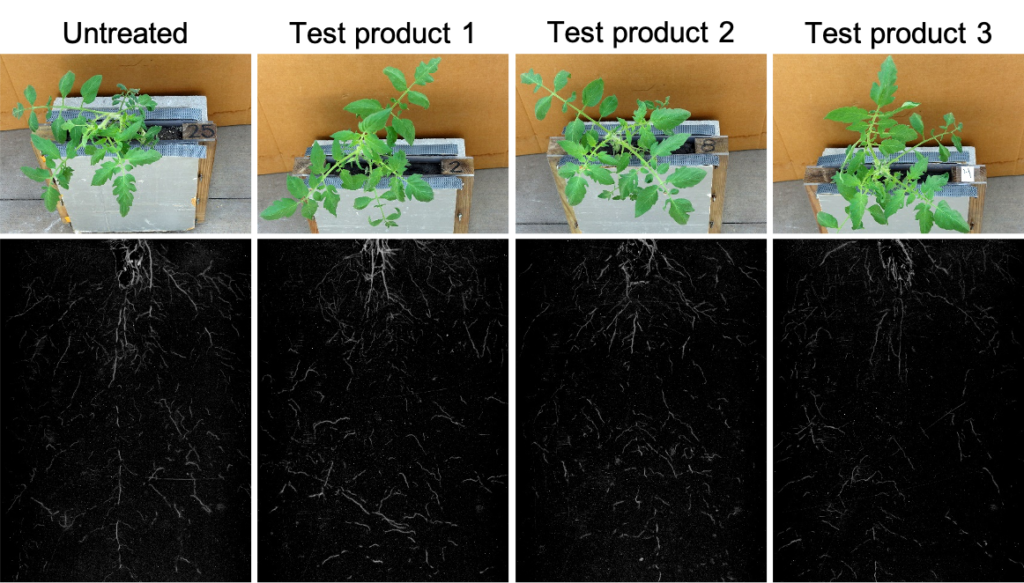
The root images (Figure 2) were analyzed for root surface area and root length. The canopy images of transplants were also taken every other day and analyzed for canopy area.
Time lapse video were produced using Rhizotron to document the effect of soil amendments and microbial nutrient enhancers on root and nodules development in soybeans and root and shoot development in corn and wheat under controlled environment in greenhouse. The accuracy of three methods for assessing nodulation of legumes and assessing the efficacy of nitrogen fixing inoculants were compared and digital assessment of nodule volume combined with nodule counts and subjective ratings provided an overly sensitive determination of nodulation in the controlled environment.
The results of the above studies clearly demonstrated that rhizotron combined with image analysis techniques can be used for nondestructive, quick, and inexpensive root and shoot growth evaluation for row and specialty crops.
Early plant growth assessment through digital imaging technologies to characterize shoot and root:
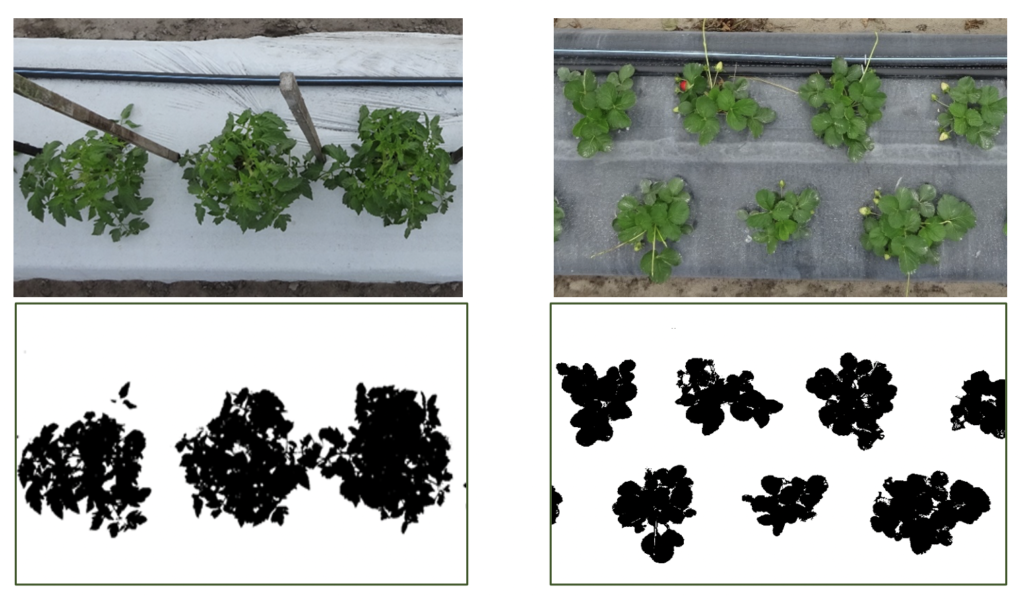
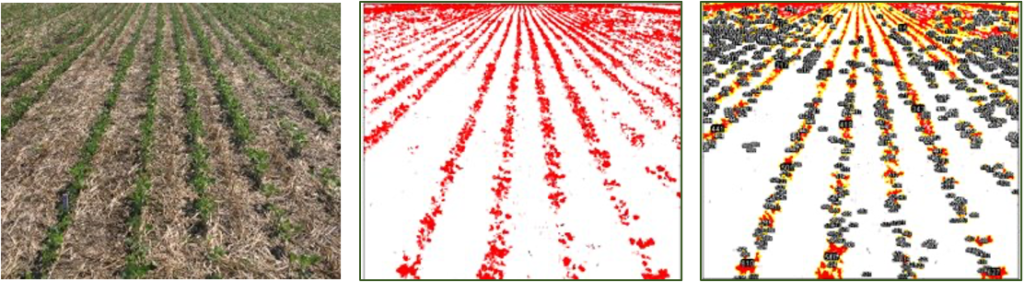
RGB images taken with digital camera of various crops and processed by image processing software were used to measure canopy cover, leaf area index, plant greenness for greenhouse and field studies (Figure 3).
On-site assessment of crop greenness through handheld NDVI sensors:
Ground based sensors have been used to measure Normalized Difference Vegetation Index (NDVI) to quantify the plant growth and development in response to different treatments and canopy temperature to quantify stress environments. Most of the times ground based sensors were extremely useful for trials and field scouting and to get very fine spatial resolution images over time except the tall and advanced stage row crops.
On-site assessment of green canopy cover during field visits captured quantitative information on green canopy cover, early plant vigor, and disease severity.
Crop growth assessment in small and large plot field trials through analysis of RGB and multispectral drone images of high resolution: Multispectral imaging camera sensors on agricultural drones have been used for taking aerial digital images for plant growth assessments to compare different treatments in small and large plot trials, plant disease estimation (Asian soybean rusts) and to record canopy temperature in large plot trials. Multispectral digital images by professional drone services provided several views of trial across locations and greenness indices as a treatment response variable throughout the crop cycle. In small and large plot trials professional drone services provided fine spatial resolution images enough to identify single plant and leaf, multiple bands allowed several response variables from single image (Figure 3).
Multispectral camera remote sensing imaging technology use Green, Red, Red-Edge, and Near Infrared wavebands to capture both visible and invisible images of crops. The multispectral images integrate with specialized agricultural software which output the information into meaningful data. However, sometimes it is challenging to use aerial digital images as pixel value do not have a direct physical interpretation and brightness caused variations across image.
Satellite imagery have been used on-farm and in field-scale trials in place of drones because of the size of the treatments and consistent imagery across the growing season with improved accuracy and less weather interference. Analysis of both drone and satellite imagery is critical to understand crop growth and development across treatments and environments.
Radar based topography for analysis of large-scale trials: Radar based information used to analyze homogeneity across experimental area due to drainage variations, exceptionally low crop growth, unbalanced treatment distribution and determine sub-field environments for analysis.
Root characterization through digital measurement: RGB and monochromatic images taken with high resolution scanner and processed by software have been successfully used to measure root length, area, volume, and diameter in greenhouse and field studies to quantify crop response to different treatments.
Digital image analysis of treated seeds for quality assessment of seed treatment:
Digital images have also been used for seed treatment quality analysis in seed efficacy trials.
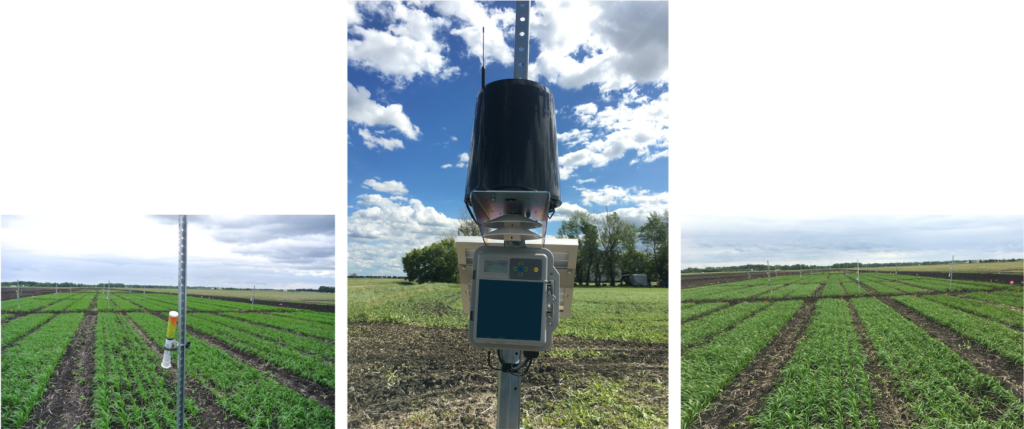
Crop canopy temperature on-site continuous sensing through infrared thermometers and data loggers: Field sensors have been used to capture weather data and continuous crop canopy temperature using an infrared thermometer and relays the information back to the field sensor. This process has been used in several experiments over the last five years to select high through put phenotypes and determine product performance well ahead of harvest. Field sensors provided 96 data points per day and using this data identified strongest performers early in the season which facilitated product selection before yield assessment for faster product development. Several bio-stimulants were evaluated in stress and full irrigation blocks. Field sensors were installed on each plot within 4 replicates in the stress and full irrigation block, for a total of 32 sensors. The stress block was managed with limited irrigation from 10 days before and 15 days after flowering, with a target of a 40% yield reduction.
In another experiment, field sensors were installed on each plot within 4 replicates planted at three locations in North America to record canopy temperature. The extensive data collected from three oat genotypes was used to develop and validate algorithms from visual and spectral data into quantifiable crop parameters to optimize varietal selection and crop management to increase grain yield and quality (Figure 4). Growing Degree Days based on the micro-climate of the crop gave better prediction of crop growth stages and crop maturity compared to the local weather station.
Evaluate drift potential of crop protection chemicals using high and low speed wind tunnel test:
High and low speed wind tunnel test designed to measure droplet size and drop size distribution from ground aerial application equipment was used to evaluate the drift potential of crop protection chemicals as well as the efficacy of drift control reducing adjuvants using several types of nozzles. Laser diffraction particle size analyzer was used to determine droplet size distribution in specific ranges from 18 to 3500 microns. Other key parameters measured were Volume Mean Diameter (VMD), uniformity of droplet size distribution (Span), percent of spray volume in droplets smaller than 105 µm or fines (%<105 µm) and percent of spray volume in droplets smaller than 730 µm (%<730 µm). Other droplet size measurements taken are the % of droplets less than 105 µm, 141 µm, 150 µm, 210 µm and 730 µm, respectively. Results were used for drift control adjuvant registration in California.
Evaluate impact of biological products on soil microbiome using phospholipid fatty acid (PLFA) test:
PFLA which provides an understanding on the effect of landscape, management, and biological practices over time on microbial community have been used to evaluate the impact of biological products and practices on the total microbial biomass and biomass of individual categories of fungi, bacteria, eukaryotes, among other species. Active carbon and soil nitrate were determined from a composite soil sample from six cores taken from each plot to a depth of 3 inches. Results revealed how various categories of microbes were affected by applied biological products and how they interacted relative to each other.
These and many other digital technologies contribute to the analysis of plant or soil responses to seed, soil, or foliar-applied innovations. Characterization of response is a critical component for successful positioning and use.
Contact AgriThority for further discussion about your needs for measurements and analysis during the early to late development stages. Email Krishan.Jindal@agrithority.com, Ignacio.colonna@agrithority.com or info@agrithority.com